In the PHP page of this project, I expand on the project scenario, challenges, directives, and PHP code structure. The summary is that it originated in a company that hosted hundreds of company sites, and it was intended to give those company administrators a high level view of site visits, devices, and time of day visits. The server side code is built in OOP PHP and integrates the Google Analytics API with the Google Visualization API to output the graphs. There isn’t a lot to cover in an HTML/CSS discussion outside of the Heat Map graph. I will focus on the logic and rendering of the Heat Map.
If you haven’t yet, first have a look at the demo. This is not live data, it displays from a semi-static data set I built that uses no secure keys or data. Play around with it for a bit and see what it does. Resize your window and note there is some animation (see notes below.)
The Challenges
The challenge is that the Visualization API doesn’t support a heat map chart. "Heat Maps" in Google Services are heat spots overlaid on a Google map. I grew my own from the time of day analytics data. It’s really not that complex and it does what the project required.
The Logic
As discussed in the Javascript/jQuery page of this project, a request is composed to the server side PHP scripting which composes a valid Google Services token that is used to issue the request to the Google Analytics API. The data is returned to the client and more jQuery/Javascript process the response to render the graphs. In the case of the Heat Map graph, the HourAndWeekHeatMap object processes the input and renders the graph.
<?php
/**
 * Recipient of AJAX request for analytics data to render the heat map charts
 * with the Google Visualization API.
 */
require_once (__DIR__ . '/classes/HourAndWeekHeatMap.php');
require_once (__DIR__ . '/classes/HourAndWeekHeatMapView.php');

$report = filter_input_array(INPUT_POST);

try {
    $HeatMap  = new HourAndWeekHeatMap(new HourAndWeekHeatMapView());
    echo $HeatMap->createHeatMap();

  } catch (Exception $e) {
    echo "Exception creating heat map : {$e->getMessage()}";
}
Rendering
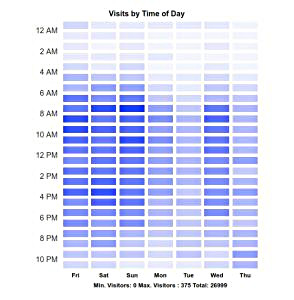
The logic is fairly straightforward. The task is to map the least number of visitors to the highest number of visitors to a set of CSS selectors. Analytics data provides us values min_visitors and max_visitors to provide start and end ranges for the metrics. I used these numbers to set a series of 11 classes (ten per range, being zero-based that is 11.) Given a data set from Analytics like so,
<?php
 $config_array = [

    // ... Other graph array members

    'time-of-day' => [
        "columnHeader" =>
        [
            "dimensions" => [
                "ga:year",
                "ga:month",
                "ga:day",
                "ga:hour",
                "ga:dayOfWeek"
            ],
            "metricHeader" =>
            [
                "metricHeaderEntries" => [
                    ["name" => "ga:users","type" => "INTEGER"]
                ]
            ]
        ],
        "data" =>
        [
            "rows" => [
                [
                    "dimensions" => ["2021","01","06","00","3"],
                    "metrics" => [
                        ["values" => ["83"]]
                    ]
                ],
                [
                    "dimensions" => ["2021","01","06","01","3"],
                    "metrics" => [
                        ["values" => ["55"]]
                    ]
                ],

                // .. continued rows for time of day data
            ]
        ]
    ]
];
. . . I set the ranges into an HourAndWeekHeatMap class property.
<?php
    /**
     * Set 11 color ranges for the data set. 0 to [n] will be lightest, [n] to
     * [n + divisor] will be darker, etc.
     *
     * @return $this
     */
    protected function setRanges()
    {
        $tot    = $this->max_visitors - $this->min_visitors;
        $per    = intval($tot / 10);
        $key    = 0;

        for ($i = 0; $i <= $tot; $i += $per) {
            $this->ranges['range' . $key] = [$i, $i + $per];
            $key++;
        }

        // Loop $per on the highest number to account for leftovers
        $this->ranges['range' . ($key -1)][1] += $per;

        return $this;
    }
I then walk the data array and add the actual classes to the array so that each data member now has the appropriate CSS class (range0, range1, range2, etc.) Day of week and visitors for the day are also added for the mouseover tooltips.
<?php
    /**
     * Helper for flattenGaResults(), populate a single row of data.
     *
     * @param array $row
     * @return array
     */
    protected function populateOutputArray($row)
    {
        $day_name = $row['dimensions'][4];
        $visitors = $row['metrics'][0]['values'][0];

        return [
            'year'      => $row['dimensions'][0],
            'month'     => $row['dimensions'][1],
            'month_day' => $row['dimensions'][2],
            'day'       => $this->weekday_names[$day_name],
            'visitors'  => $visitors,
            'class'     => $this->setClass($visitors)
        ];
    }

    /**
     * Use to set a css class for each user count range, eg.
     * range0 = light color, range11 = dark color.
     *
     * @param string $count
     * @return string
     */
    protected function setClass($count)
    {
        foreach ($this->ranges as $key => $arr) {
            if (($count >= $arr[0]) and ($count <= $arr[1])) {
                return $key;
            }
        }

        return 'no-class-this-is-an-error';
    }
This data is provided to injected object HourAndWeekHeatMapView for rendering. At this point it’s a trivial task to walk the data and output rows for the table body.
<?php /** * Walk the data rows and output the heat map table body. * * @throws Exception * @return string */ protected function tableRows() { if (! is_array($this->data['data'])) { throw new Exception('Data is not an array in view.'); } $rows = ''; foreach ($this->data['data'] as $hour_key => $row) { $rows .= $this->outputTableRow($hour_key, $row); } return $rows; } // other methods here ..... walks table cells for each // day then . . . /** * Helper for outputTableRow(), output a single cell of valid data. * * @param string $hour_key * @param array $hour_data * @return string */ function outputTableCell($hour_key, $hour_data) { return " <td class=\"data {$hour_data['class']}\"" . " title=\"{$this->cellToolTipContent($hour_key, $hour_data)}\"" . " aria-role=\"grid\"" . " aria-label=\"{$this->cellToolTipContent($hour_key, $hour_data)}\"" . "> </td>" . PHP_EOL; }
There are other helper methods to fill up days without data, format the date from 24 hour time, but that is the gist. The CSS is pretty much what you would expect.
table.heatmap-display .no-data { background: #f5f5f5; }
table.heatmap-display .range0 { background: #f6f8ff; }
table.heatmap-display .range1 { background: #ecefff; }
table.heatmap-display .range2 { background: #dde2ff; }
table.heatmap-display .range3 { background: #cdd5ff; }
table.heatmap-display .range4 { background: #bec8ff; }
table.heatmap-display .range5 { background: #a8b5ff; }
table.heatmap-display .range6 { background: #97a6ff; }
table.heatmap-display .range7 { background: #8295ff; }
table.heatmap-display .range8 { background: #7186ff; }
table.heatmap-display .range9 { background: #5c75ff; }
table.heatmap-display .range10 { background: #4864ff; }
table.heatmap-display .range11 { background: #2e4eff; }
Notes and Comments
- This discusses PHP code more than CSS, but it presents how we built the Heat Map graph from raw Analytics data. It was more "fun" than the rest of the project because it didn’t make my head hurt so much.
- The demo does not query live data, reload/play with it all you like. I have created a MockAnalyticsResponse object that dynamically sets the dates from a configuration file. The metrics are all static, it will show the same numbers each day you return.
- See the PHP discussion of this project and the Javascript discussion for how the data is actually requested and rendered.
- "Show me the codez!" This code is not open source, however serious inquiries from potential clients can request samples.
- Return to HTML/CSS Development and Design
- Google Analytics with Visualization Graphs (HTML/CSS)
- Semantic HTML Design and Development
- CSS Code Style and Development
- Ensure Web Pages are Accessible
- Search Engine Optimization Services (SEO)